Category Archives: Tutorials

What is a Spectrogram?

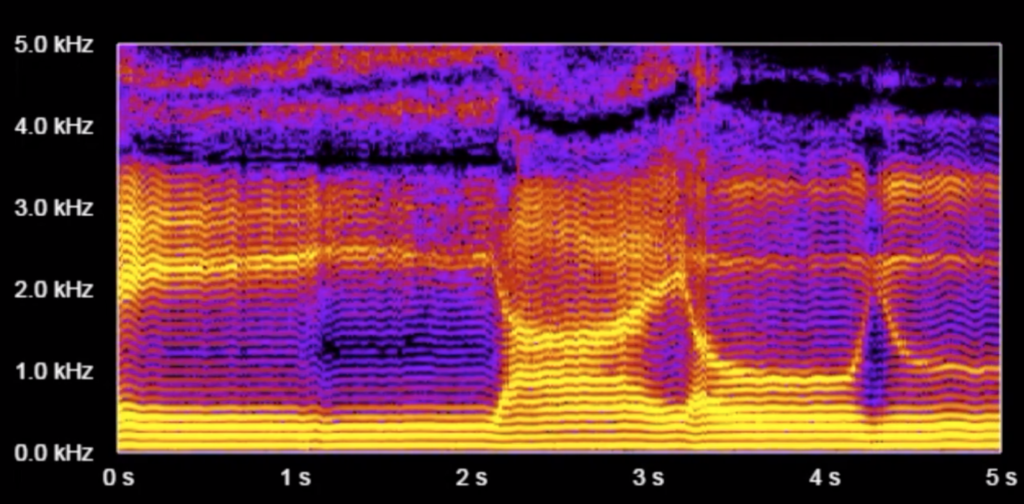
I once took a Speech Recognition AI course, and one of the concepts that fascinated me was that of spectrograms. Here's the spectrogram for the sound of a person speaking the words "nineteenth century"

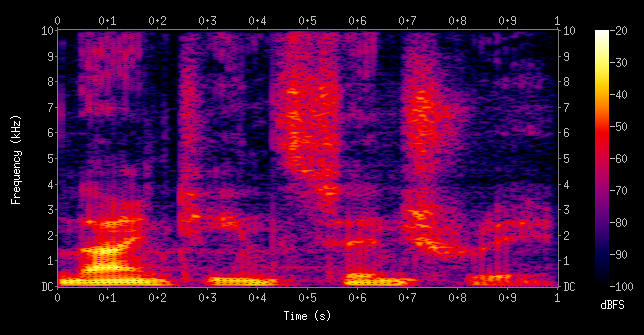
A spectrogram helps us visualize sounds by decomposing them into their basic frequencies. In this type of visualization, the x axis is time (the progress through the audio clip), the y axis is frequency (low or high pitched), and the color represents loudness.

Something cool about these plots is that trained professionals can actually deduce what words are being uttered in an audio clip just by looking at the corresponding spectrogram. The representation is so useful for this purpose that many speech recognition software systems create a spectrogram as an initial step in the process of transcribing speech to text.

This is all possible because in speech, each sound has a characteristic look in the spectrogram. For example, different vowels can be distinguished by something called "formants": the position of a series of bands that show up near the bottom of a spectrogram. More specifically, the first 3 formants, F1, F2, and F3:

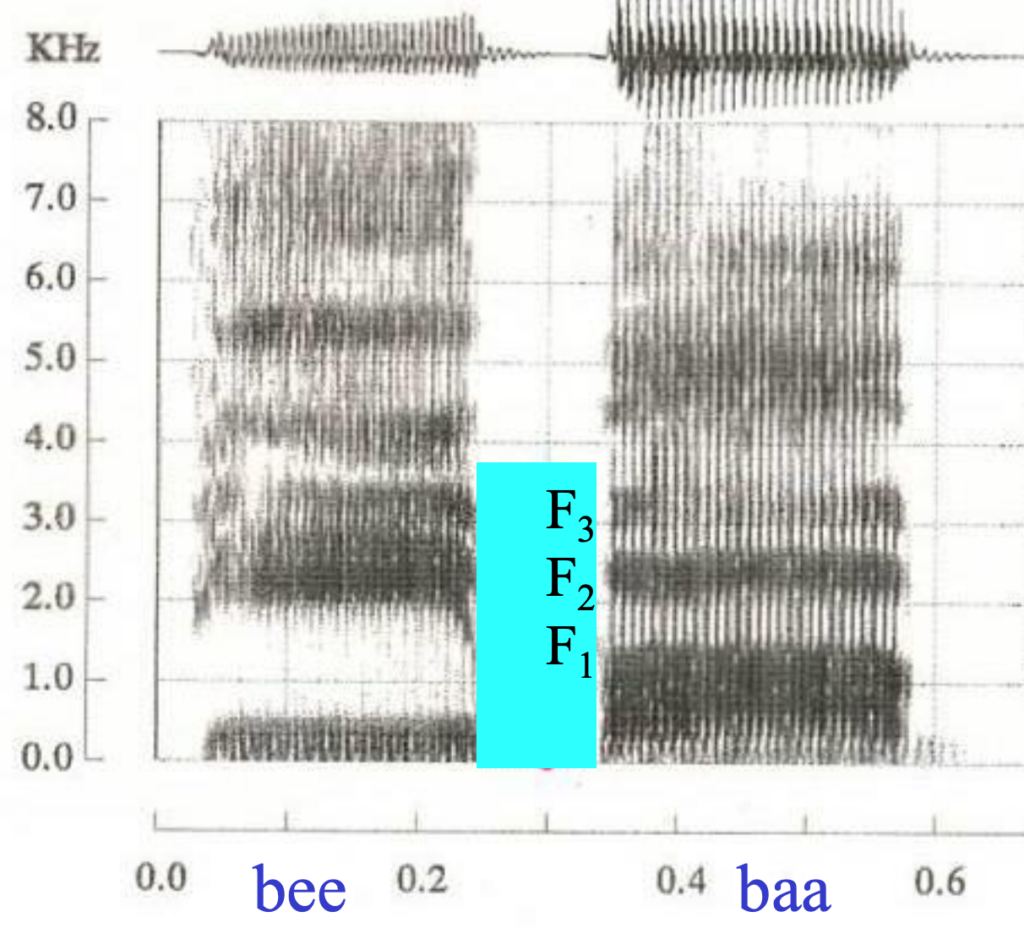
The image above shows the histogram for the words "bee" and "baa", showing the difference in the frequencies of the formants for these two vowels.

Here's a chart that shows the frequency of the formants for several English vowels:

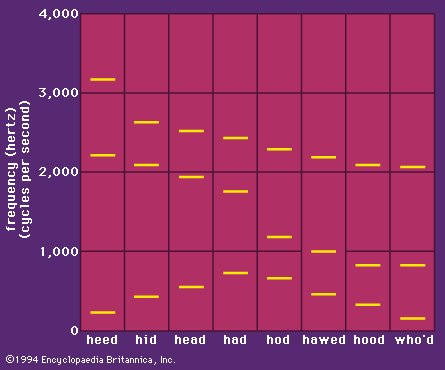
And here's a cool fact from Encyclopædia Britannica: "Most people cannot hear the pitches of the individual formants in normal speech. In whispered speech, however, there are no regular variations in air pressure produced by the vocal cords, and the higher resonances of the vocal tract are more clearly audible. It is quite easy to hear the falling pitch of the second formant when whispering the series of words heed, hid, head, had, hod, hawed, hood, who’d." (Just don't try this too much, or you'll get dizzy from exhaling so much air.)

Another characteristic of vowels is that they have "overtones". These manifest themselves as equally-spaced horizontal lines that appear in a histogram when we see it in high resolution. In the following chart, pay attention to the very fine evenly-spaced horizontal lines (not the broad yellow blobs):

(Note that formants can span across several overtones.)

On a piano or a guitar, whenever you play a middle C, you're not only producing a pure 262Hz (middle C) sound. The instrument actually also produces at the same time a tone at twice the frequency, three times the frequency, etc. at integer multiples of that C note's frequency (aka the "fundamental frequency"). These are called "overtones" and are what gives a piano or a guitar its characteristic sound (aka its "timbre"), as opposed to sounding like a computer-generated beep. A similar phenomenon happens when a person pronounces a vowel (or any sound that uses the vocal chords). This is why we saw the equally-spaced parallel lines in the high-res spectrogram of vowel sounds.

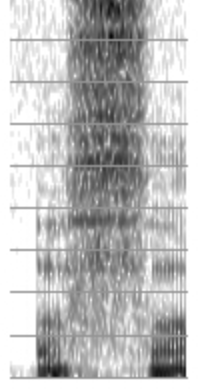
While vowels can simply be identified by their formants, consonants have a wide range of looks and durations on a spectrogram. A "b" consonant and an "m" consonant look very different in the plot. Some easy to spot consonants are sounds such as "shhh", "chhh", "zzz", and "sss", since they have a very characteristic high-pitched component, so you will see a band of high frequencies light up at the top of the spectrogram. For example, here is a "sss" sound sandwiched between two vowels:

Just for completeness, I should mention that it's not always so clear-cut how to map a slice of a spectrogram to its corresponding phoneme. Different speakers pronounce words in slightly different ways and have different vocal ranges. And even when only considering a single speaker, individual sounds can change depending on the surrounding vowels or consonants. Also, let's not forget that a spoken sentence would look very different from normal on a spectrogram when it's whispered or spoken quickly.

There are smartphone apps that generate a spectrogram in real time. My favorite one so far is SpectrumView by Oxford Research (iOS only), but there are a few others out there. You can also try this cool-looking web app or this more sober-looking web app (make sure to press the Mic checkbox). Some fun things to try are: vowel sounds (notice the overtones? the formants? can you determine your vocal range?), consonant sounds ("sss", "zzz", "mmm", "rrr", "thh", "tee", "dee"), whispering, playing a note on a piano or another instrument (notice the overtones?), whistling (notice the lack of strong overtones?), a waterfall (white noise), and that high-pitched sound coming from the TV that you hear but your parents don't.

So there you have it. Now you're able to see sounds.

P.S. If you'd like to learn more, check out the following links:

Sources

The images are from:

Code: DERIBALL for TI-83/84 Plus

As an appendix to the previous tutorial, and in honor of my first programming language TI BASIC, here's a similar physics simulation but for the TI-83 Plus or TI-84 Plus graphing calculator. I wrote this calculator program almost five years ago after learning about dot products, so you might say the html5 tutorial I wrote recently is kind of *puts sunglasses on* derivative.

PROGRAM:DERIBALL
: ClrDraw
: Input
: Pt-On(X,Y)
: X->O:Y->P
: Input
: O-X->V:P-Y->W
: Xmin->A
: Xmax-Xmin->B
: Ymin->C
: Ymax-Ymin->D
:
: -D/700->G
: 0.9->F:0.8->E
:
: While 1
: If (Y1(X)≥Y)≠(Y1(X+V)>(Y+W))
: Then
: nDeriv(Y1,X,X)->J
: (V+WJ)/(1+J^2)->K
: (F+E)K-EV->V
: (F+E)KJ-EW->W
: End
: X+V->X
: Y+W->Y
: Pt-On(X,Y)
: W+G->W
: End

To use the program (after having entered the code into your calculator as a new program), edit Y1 under the Y= menu to be any function you like. Try Y1=X^2, for example. Now plot your preferred function and set the window any way you prefer. I've set Xmin and Xmax to -4 and 4, respectively, and Ymin and Ymax to 0 and 10, respectively.

Now run DERIBALL under the PRGM menu. This will show a moveable crosshair next to your plot; select the position for the hypothetical slingshot from which the ball will launch and press ENTER. Then select the point from which you'll release the ball from the slingshot. Voila! You'll now see the ball move around with gravity and bounce against the curve with friction.

Tutorial: Curve Bounce in HTML5

In this tutorial we'll program a simulation of a red rubber ball that bounces off of a sine wave in a frictionless, gravity-less environment (a very typical scenario). We'll be using Javascript, the HTML5 Canvas element, and the easeljs library.

This tutorial is different from others I have found in that it internally stores the hitting surface as a mathematical function rather than a collection of lines, and it uses the derivative of the function to calculate the response of each collision.
Curve Bounce

    You'll need:

  • Some programming experience in Javascript or Actionscript
  • High School Physics (vectors, velocity)
  • A web browser that supports HTML5 (If the demo linked below works, you're all set)
  • A text editor such as TextWrangler (Free, Mac), Notepad++ (Free, Windows), or VIM (Free, Mac, Windows, and Linux). VIM has a steeper learning curve than the other two since it's intended for use without mouse input, but learning it can help you edit your code faster.

Step 1: Set up

You'll find four starter files in the above download

  • index.html - contains the 600-by-400 canvas element we'll be drawing on (you can change these dimensions, of course!) and imports the other three files. Open index.html in a modern internet browser (or reload the page if already open) anytime you'd like to test your program
  • normalize.css - a normalization stylesheet that helps make website styles more consistent across browsers
  • style.css - any other css styling goes here. Edit this file to change the canvas's background color
  • main.js - we'll write the main code for our program in this file

For this tutorial, everything's set up so that we'll only need to modify main.js. Inside main.js you'll find the following code:

/*
 * runs when index.html is fully loaded
 */
window.onload=function() {

}

Since our onload function is empty, when you open index.html on your favorite browser, you'll see a website reminiscent of Kazimir Malevich's painting Black Square. Pretty cool, but not exactly what we're looking for.

Step 2: You're on the ball

Let's add a ball to our canvas. Modify main.js so that it looks like this:

// initialize stage and ball globally
var stage, ball;

/*
 * runs when index.html is fully loaded
 */
window.onload=function() {
    //initialize stage object, where "canvas" references the id of our canvas
    stage = new createjs.Stage("canvas");

    // initialize ball object
    ball = new createjs.Shape();
    // select ball color to be red.
    ball.graphics.beginFill("#ff3333");
    // draw circle of radius 5 at position (0, 0) relative to the ball's
    //   coordinates
    ball.graphics.drawCircle(0, 0, 5);
    // set ball object's coordinates
    ball.x = 120;
    ball.y = 50;
    // add our ball to stage so that it actually gets drawn.
    // (this needs to be done only once per object)
    stage.addChild(ball);

    // draw all shapes to canvas
    stage.update();
}

Note that we initialized stage and ball outside of the onload function so that we'll be able to reference them later when we add animation to our program. If you now open index.html, you should see a red ball on a black canvas.

Step 3: Adding motion

It's time to get the ball rolling. Lets add the following declarations at the beginning of the file:

var vx=10, vy=10;

vx will represent the ball's velocity in the x direction (negative: left, positive: right) measured in pixels per frame. vy will be the velocity in the y direction (negative: up, positive: down). We're initializing both to +10.
Now add the following code right before the the onload function's ending curly bracket:

    createjs.Ticker.setFPS(60);
    createjs.Ticker.addEventListener("tick", tick);

This tells the program to call the function tick() (which we'll define momentarily) on every "tick" event, that is, every 1/60th of a second.

Add the following function at the end of the file, after the onload function:

/*
 * called every frame (60 times per second)
 */
function tick() {
    // if ball would be out of bounds on the next frame,
    //   make it bounce away from the wall
    if(ball.x+vx<0) {
        vx = Math.abs(vx);     }
    if(ball.x+vx>stage.canvas.width) {
        vx = -1*Math.abs(vx);
    }
    if(ball.y+vy<0) {
         vy = Math.abs(vy);
    }
    if(ball.y+vy>stage.canvas.height) {
        vy = -1*Math.abs(vy);
    }
    // update the ball's position according to the current velocity
    ball.x += vx;
    ball.y += vy;

    // draw all shapes to canvas
    stage.update();
}

and now the ball bounces off the walls.

Step 4: Drawing the curve

As promised, we will make the ball bounce off of a fancy, mathematically defined curve. First, however, we'll need to define our mathematical curve and draw it on the canvas. Add the following function after the tick() function, that is, at the very bottom of main.js:

/*
 * defines the the shape of curve the ball will be bouncing off of.
 * Try playing around with the values inside this function!
 */
function f(x) {
    return 100*Math.sin((2*x)*3.14/180)+300;
}

This is a function in the sense you learned in math class: we give it an input number, and it gives us an output number. In this case, it gives us the sine curve you've seen in the end result. Note that the origin (0, 0) of our canvas is the upper-left corner, and that the y-axis increases as we go down the canvas. The x-axis works as usual.

Now, to actually draw the curve to the canvas, we'll approximate it as a series of line segments. Edit the onload function so that it looks as follows (where we've highlighted the new code):

// initialize stage and ball globally
var stage, ball;
// set ball velocity
var vx=10, vy=10;

/*
 * runs when index.html is fully loaded
 */
window.onload=function() {
    //initialize stage object, where "canvas" references the id of our canvas
    stage = new createjs.Stage("canvas");

    // initialize ball object
    ball = new createjs.Shape();
    // select ball color to be light blue.
    ball.graphics.beginFill("#3399CC");
    // draw circle of radius 5 at position (0, 0) relative to the ball's
    //   coordinates
    ball.graphics.drawCircle(0, 0, 5);
    // set ball object's coordinates
    ball.x = 120;
    ball.y = 50;
    // add our ball to stage so that it actually gets drawn.
    // (this needs to be done only once per object)
    stage.addChild(ball);

    // initialize curve object
    curve = new createjs.Shape();
    // set line width to 2px
    curve.graphics.setStrokeStyle(2);
    // select a random color for the line
    curve.graphics.beginStroke(createjs.Graphics.getRGB(Math.floor(Math.random()*256),
                                  Math.floor(Math.random()*256), Math.floor(Math.random()*256)));
    // start first line segment at position (0, f(0))
    curve.graphics.moveTo(0, f(0));
    // keep on drawing line segments to (i, f(i)) as i moves across the width of the canvas
    for(var i=0; i<stage.canvas.width; i++) {
        curve.graphics.lineTo(i, f(i));
    }
    // add our curve object to stage so that it actually gets drawn.
    stage.addChild(curve);

    // draw all shapes to canvas
    stage.update();

    // set framerate to 60FPS
    createjs.Ticker.setFPS(60);
    // call tick(event) on every "tick"
    createjs.Ticker.addEventListener("tick", tick);
}

Where the Math.floor() function rounds down and Math.random() generates a number in the interval [0, 1), so Math.floor(Math.random()*256) generates a random number between 0 and 255, inclusive.

At this point you'll see the curve on the screen, but the ball ignores it completely(!)

Step 5: Detecting curve crossing

When is the right time to bounce? How do we detect if the ball is about to cross the curve? Since our curve is a function in the mathematical sense, we know that there will only be one 'y' value for the curve for each 'x', and assuming our function will be continuous, we can simply check if the ball will be below the curve on the next frame, i.e. if its 'y' value will be greater than the curve's 'y' value.

Add the following code at the very beginning of the tick() function, right after its first opening curly brace:

    // check if a crossing is about to happen.
    if((ball.y+vy) >= f(ball.x+vx)) {
        // if ball would cross the curve on next frame, log the message "crossed" to console
        console.log("crossed");
    }

At this point a new "crossed" message will be printed to the javascript console every time the ball crosses the curve. (This link explains how to access the javascript console in different browsers). In some browsers, printing to the javascript console makes the program crash if the console isn't open, so comment out the console.log line after you're done testing.

Let's bounce.

Step 6: Bouncing off the curve

Our program now knows where the ball hits the curve, but we'll need more information about the direction the curve faces at the collision point to know how the ball will bounce.

Right after the end of the f(x) function, define the following function:

/*
 * returns the derivative of f(x) evaluated at x
 */
function dfdx(x) {
    return (f(x+0.00001)-f(x))/0.00001;
}

If you've taken Calculus, you'll recognize that dfdx(x) is an approximation to the derivative of the curve f(x) we drew earlier. If you haven't taken Calculus, all you need to know is that dfdx(x) measures the slope of the curve f(x) at point x.

When dealing with the four walls, we simply had to change the sign of one of the components of the velocity to make the ball bounce. How do we bounce at an angle?

Once we've defined dfdx(x), we can make the ball bounce by adding the following code right after the commented-out console.log command:

        var J = dfdx(ball.x);
        var K = 1+J*J;
        var tangentComponent = {x:(vx+vy*J)/K, y:J*(vx+vy*J)/K};
        var normalComponent = {x:J*(vx*J-vy)/K, y:-1*(vx*J-vy)/K};
        vx = tangentComponent.x - normalComponent.x;
        vy = tangentComponent.y - normalComponent.y;

This code separates the velocity vector into two component vectors—one tangent to the curve at the collision point and one normal (perpendicular) to it—and then puts the components back together with the perpendicular component flipped.

Now open index.html. If everything worked well, the ball should now bounce off the curve. Nice!

Conclusion

Here concludes this tutorial. For larger projects, remember to minify your Javascript files before uploading them to make your program load faster. Some Ideas of how to expand this project:  try adding sound, visual effects, gravity, and friction to the scene.