I gave a presentation about Kusto Query Language (KQL) within Microsoft for a Learning Day held by my division, and then gave the talk again for an internal presentation series about data-driven methods. I've now published the recording on YouTube so that a wider audience can benefit from it as Kusto keeps on gaining popularity.
You can watch it here:
Kusto is a really fun and fast query language for analyzing and visualizing log data. I hope that people will enjoy it as much as I did.
Update May 2022:
The video has seen a steady flow of about 260 views per month since it was released a year ago. 47% of the view traffic originated from search within YouTube, 14% from suggested videos on YouTube, and 12.5% from external sites (mostly Google Search). 26.5% from other YouTube sources.
I've also recently transcribed the video to add accurate closed captions.
In Google Code Jam this year, there was a problem called "Cheating Detection" that was very different from the usual algorithm-based problems. It was more data-driven: it involved finding the cheater among a set of students, given only the scores of all students in each of the questions in an exam, and the mechanism of cheating that the cheater used (cheating only 50% of the time).
After the round was over, I went to see the solutions of the top contestants, to see what sorts of methods they used to obtain a solution. The solution had to detect the cheater with very high probability, and also needed to be a fast enough program to type that it would be among the first submitted. I found the top solution to be surprisingly simple in its code, so I tried to figure out a mathematical explanation for why it worked. I ended up making a video with this explanation.
My sister and I worked on an electronics project during a holiday a few years back. We created a bot that helped us capture a shiny Pokémon—a creature that appears with very low probability—in the video game Pokémon Ultra Moon. Not only was it a fun a vacation project, but it also helped my sister gain exposure to programming and electronics concepts.
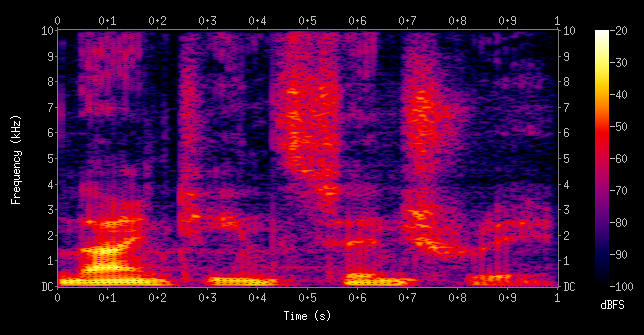
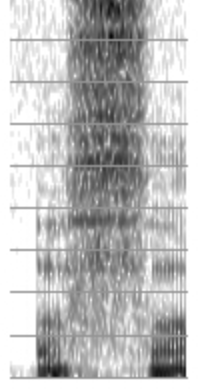
I once took a Speech Recognition AI course, and one of the concepts that fascinated me was that of spectrograms. Here's the spectrogram for the sound of a person speaking the words "nineteenth century"
A spectrogram helps us visualize sounds by decomposing them into their basic frequencies. In this type of visualization, the x axis is time (the progress through the audio clip), the y axis is frequency (low or high pitched), and the color represents loudness.
Something cool about these plots is that trained professionals can actually deduce what words are being uttered in an audio clip just by looking at the corresponding spectrogram. The representation is so useful for this purpose that many speech recognition software systems create a spectrogram as an initial step in the process of transcribing speech to text.
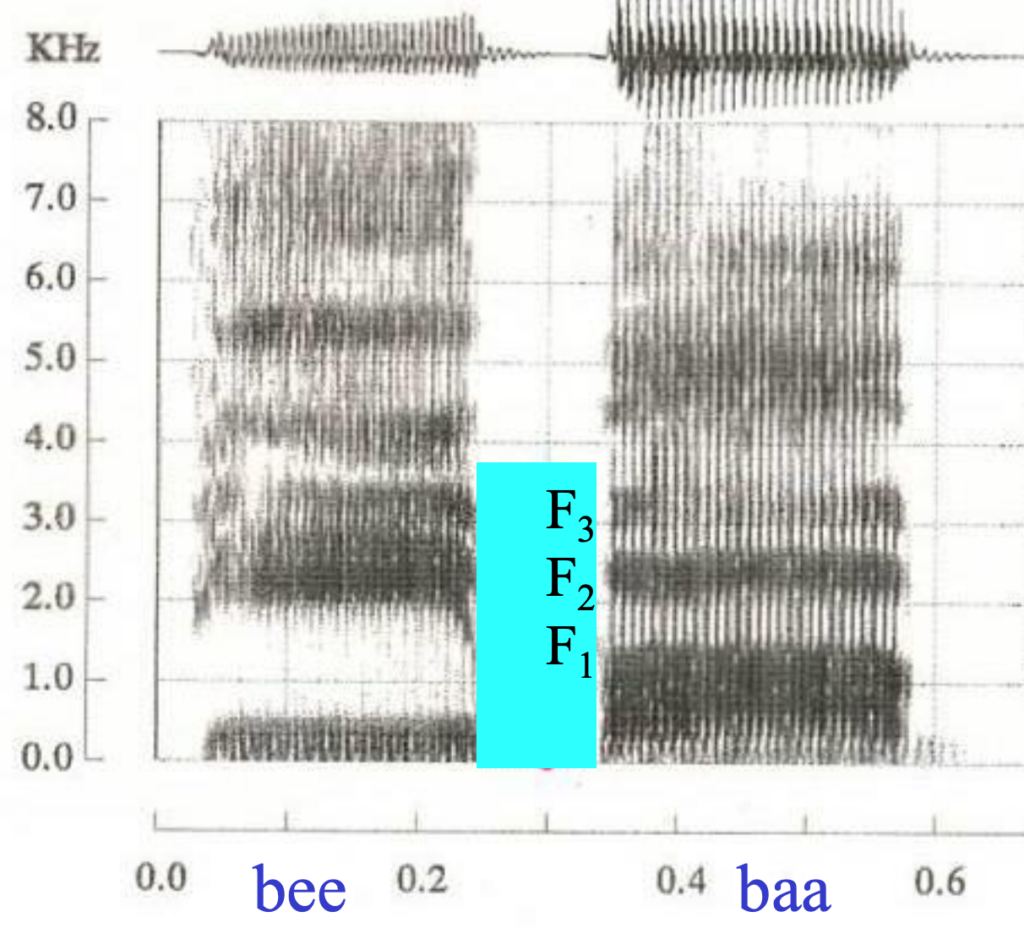
This is all possible because in speech, each sound has a characteristic look in the spectrogram. For example, different vowels can be distinguished by something called "formants": the position of a series of bands that show up near the bottom of a spectrogram. More specifically, the first 3 formants, F1, F2, and F3:
The image above shows the histogram for the words "bee" and "baa", showing the difference in the frequencies of the formants for these two vowels.
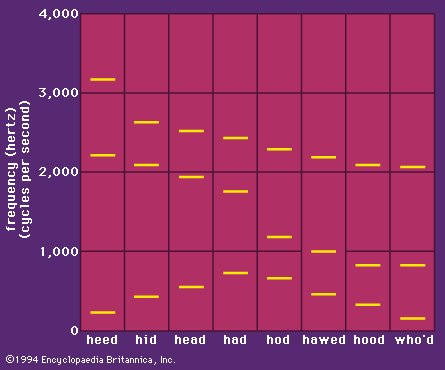
Here's a chart that shows the frequency of the formants for several English vowels:
And here's a cool fact from Encyclopædia Britannica: "Most people cannot hear the pitches of the individual formants in normal speech. In whispered speech, however, there are no regular variations in air pressure produced by the vocal cords, and the higher resonances of the vocal tract are more clearly audible. It is quite easy to hear the falling pitch of the second formant when whispering the series of words heed, hid, head, had, hod, hawed, hood, who’d." (Just don't try this too much, or you'll get dizzy from exhaling so much air.)
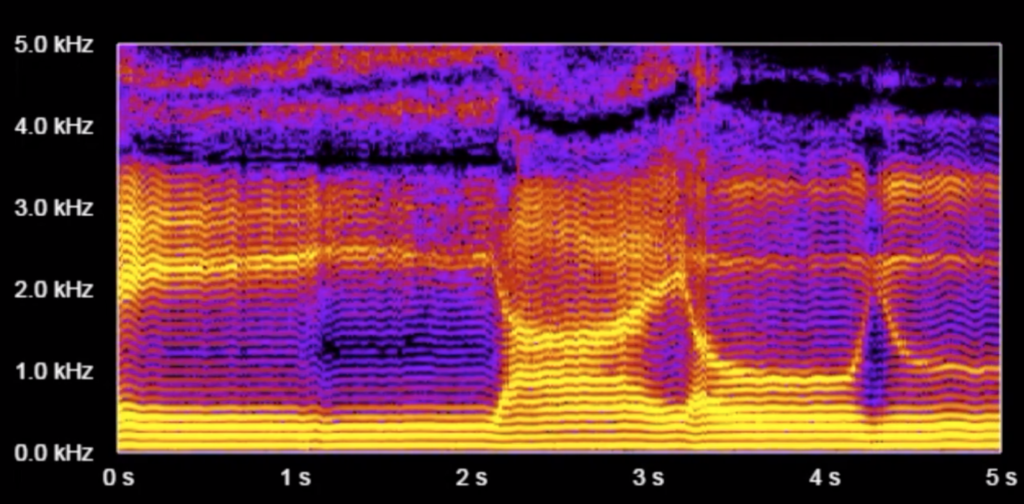
Another characteristic of vowels is that they have "overtones". These manifest themselves as equally-spaced horizontal lines that appear in a histogram when we see it in high resolution. In the following chart, pay attention to the very fine evenly-spaced horizontal lines (not the broad yellow blobs):
(Note that formants can span across several overtones.)
On a piano or a guitar, whenever you play a middle C, you're not only producing a pure 262Hz (middle C) sound. The instrument actually also produces at the same time a tone at twice the frequency, three times the frequency, etc. at integer multiples of that C note's frequency (aka the "fundamental frequency"). These are called "overtones" and are what gives a piano or a guitar its characteristic sound (aka its "timbre"), as opposed to sounding like a computer-generated beep. A similar phenomenon happens when a person pronounces a vowel (or any sound that uses the vocal chords). This is why we saw the equally-spaced parallel lines in the high-res spectrogram of vowel sounds.
While vowels can simply be identified by their formants, consonants have a wide range of looks and durations on a spectrogram. A "b" consonant and an "m" consonant look very different in the plot. Some easy to spot consonants are sounds such as "shhh", "chhh", "zzz", and "sss", since they have a very characteristic high-pitched component, so you will see a band of high frequencies light up at the top of the spectrogram. For example, here is a "sss" sound sandwiched between two vowels:
Just for completeness, I should mention that it's not always so clear-cut how to map a slice of a spectrogram to its corresponding phoneme. Different speakers pronounce words in slightly different ways and have different vocal ranges. And even when only considering a single speaker, individual sounds can change depending on the surrounding vowels or consonants. Also, let's not forget that a spoken sentence would look very different from normal on a spectrogram when it's whispered or spoken quickly.
There are smartphone apps that generate a spectrogram in real time. My favorite one so far is SpectrumView by Oxford Research (iOS only), but there are a few others out there. You can also try this cool-looking web app or this more sober-looking web app (make sure to press the Mic checkbox). Some fun things to try are: vowel sounds (notice the overtones? the formants? can you determine your vocal range?), consonant sounds ("sss", "zzz", "mmm", "rrr", "thh", "tee", "dee"), whispering, playing a note on a piano or another instrument (notice the overtones?), whistling (notice the lack of strong overtones?), a waterfall (white noise), and that high-pitched sound coming from the TV that you hear but your parents don't.
So there you have it. Now you're able to see sounds.
P.S. If you'd like to learn more, check out the following links:
A video that briefly explains spectrograms, and shows some sample sounds and their corresponding spectrograms
Slides from the Speech Recognition lecture from an Intro to AI class at U Penn
Link to some recent Speech Recognition research that makes use of spectrograms, just to show that I'm not making up the fact that spectrograms are actually useful in practice
The program Praat is used by linguists to create spectrograms and analyze speech recordings in general